After receiving my input and conducting thorough research, Tom Howard Ph. D. from AthenaInvest developed a system for categorizing money managers based on their strategies. This system defines strategy as the approach used by an investor when analyzing, purchasing, and selling stocks. Money managers are typically eager to discuss their investment approach, with some being able to elaborate for up to half an hour. The strategy for mutual funds is outlined in the prospectus, specifically in a section titled “strategy.” Dr. Howard’s patented algorithm is used to scan this section and identify the “elements” that a manager utilizes to implement their strategy. These elements refer to evaluation criteria with specific standards that must be met for security selection, such as a P/E ratio, future growth rate in earnings per share, or return on equity. By using this algorithm and analyzing prospectuses, all U.S. and International active equity mutual funds domiciled in the U.S. (approximately 7,800, including all share classes) are classified into one of ten strategies listed below.
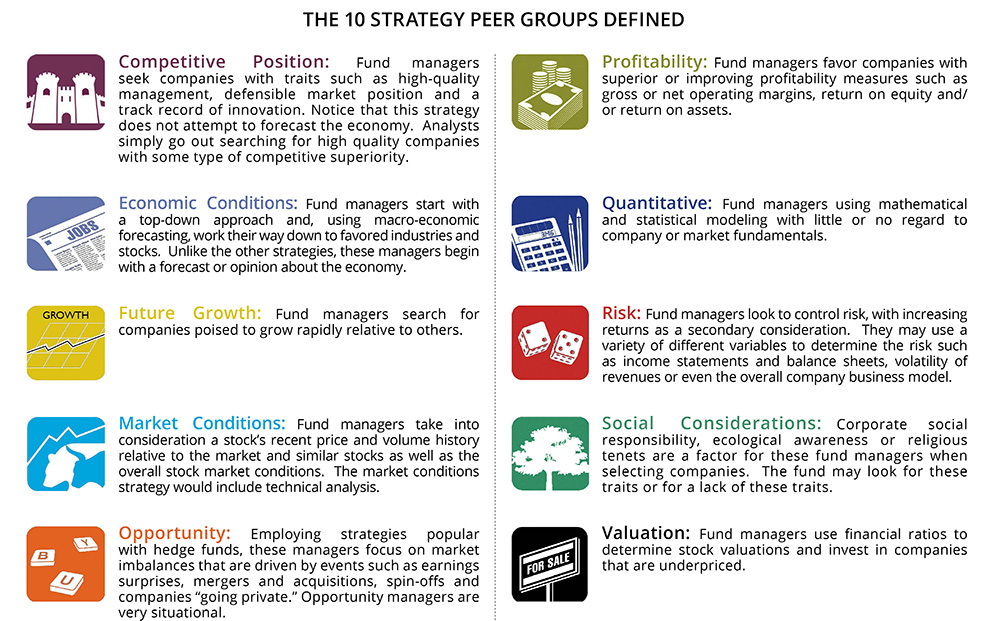 10 Strategy Peer Groups Defined
It is crucial to note that the AthenaInvest system has distinct definitions for valuation and future growth, compared to the characteristic or “style” grid. This grid categorizes stocks based on size and a valuation measure, but AthenaInvest defines valuation managers as those who prefer purchasing undervalued companies. This can be determined through various methods, such as Price-to-Earnings, book value or sales, Benjamin Grahams’ Central Value Formula, the dividend discount model, or liquidation value.
As per the AthenaInvest system, managers of Future Growth aim to achieve growth through various approaches. Some may prioritize increasing earnings per share, while others may focus on revenue or the overall growth of the company. There may also be managers who prioritize sustainable growth or seek to accelerate growth.
Performance of Strategy
It is our belief that organizing mutual funds based on their strategies can provide valuable peer groups for examining performance. The table below displays the average monthly performance for ten strategies in the past thirty-four years, along with their standard deviation. The strategies are also ranked based on their return divided by the standard deviation of monthly returns. We hypothesize that managers of successful strategies have identified key factors that contribute to long-term returns. In contrast, we believe that underperforming strategies may rely on elements or attempt to exploit factors that do not result in returns.
The strategies that have shown the best performance in terms of return and risk over a period of time are Opportunity and Competitive Position. Interestingly, the bottom of the table consistently includes four strategies, regardless of whether they are sorted by return or return/risk: Economic Conditions, Social Considerations, Market Conditions, and Risk. This leads us to believe that either these strategies are not effective on average, or the managers using them are not skilled at implementing them. It is possible that if we were to survey individuals who invest for themselves and categorize them based on their strategy, we would find that Economic Conditions and Market Conditions are the most popular choices. However, according to AthenaInvest’s research, these strategies, although appealing, do not seem to be successful for professional money managers. It is worth noting that the group of managers who aim to reduce risk have the highest standard deviation of returns.
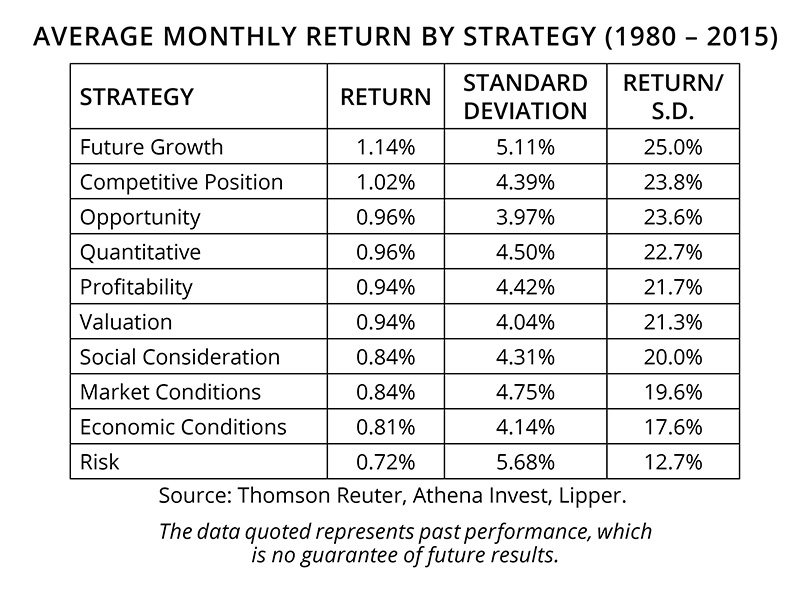 The chart above shows the average monthly return by strategy from 1980 to 2015.
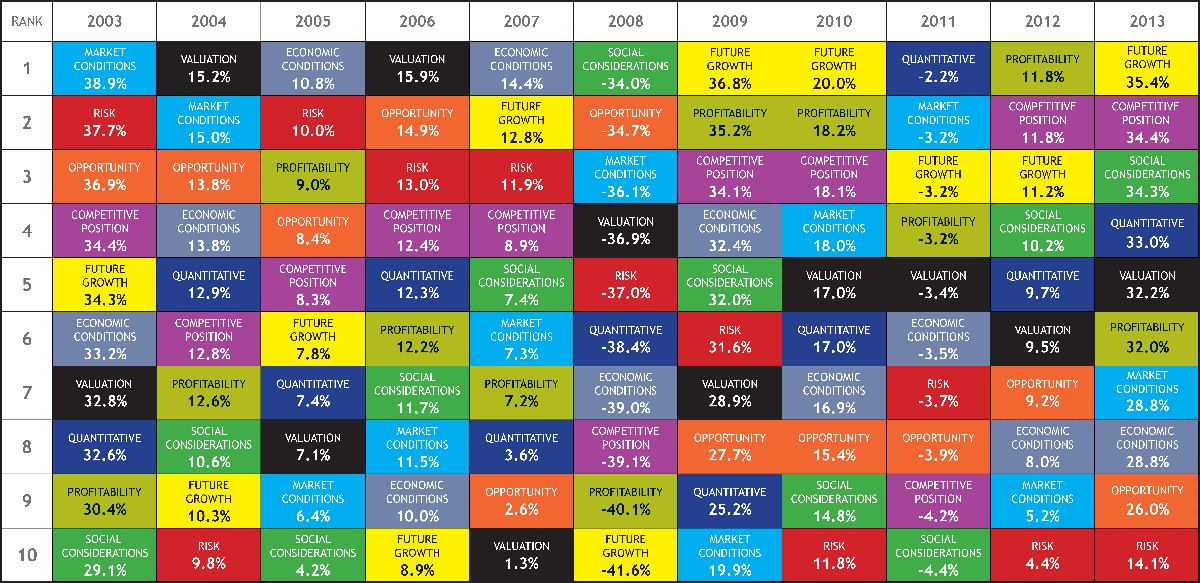
The effectiveness of each strategy over time has been shown in the chart above. However, it should be noted that the effectiveness of each strategy is subject to change depending on the economic and financial market conditions. This can be seen in the performance ranking of the ten strategies for each year over the past decade, as shown in the following chart.
The performance of different strategies may alternate between leading and lagging. For instance, valuation investing was considered unsuccessful in the late 1990s, but it became the top-performing strategy for four out of six years from 2001 to 2006. However, it did not perform as well from 2009 to 2013. Another example is Future Growth, which was highly successful in the late 1990s, but struggled from 2001 to 2008 and remained in the bottom half of strategies. Then, from 2009 to 2015, it was the best performing strategy four times and the third best twice. This is because strategies perform differently depending on economic and market conditions. It is not because managers continuously alternate between making smart and foolish decisions. The effectiveness of strategies changes over time, but managers stick to their chosen strategy. To mitigate extreme performance fluctuations in changing market and economic conditions, we suggest a combination of strategies rather than trying to predict which one will perform best each year.
Themes Chart
Have you ever selected a manager or a mutual fund based on their impressive three-year performance, only to be let down by their performance in the following one or two years? Despite its popularity, we believe that the three-year performance metric is not a reliable indicator of future performance. This could be due to the fact that the effectiveness of a strategy can change over time. Our perspective is that a manager may have had a good three-year performance because their strategy was effective during that time period. However, as market and economic conditions shift, their strategy may no longer be suitable. We do not believe that the manager suddenly became lazy or incompetent. It is simply that their strategy does not perform as well in the new conditions. Various studies have shown that investors tend to trade mutual funds too frequently, leading to high turnover and poor performance. Unknowingly, they become “hot strategy chasers,” investing in a fund when its strategy is hot, and then selling it when it cools down, only to move on to a fund that is currently pursuing a popular strategy.
Funds’ Popularity Based on Strategy
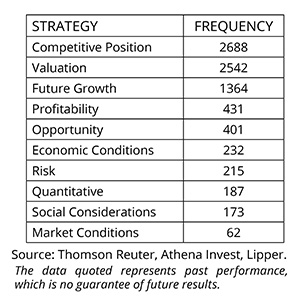 Frequency of Strategies
According to AthenaInvest, out of 8295 mutual funds (including all share classes), the chart below illustrates the popularity of each strategy among managers. The most widely pursued strategies are competitive position, valuation, and future growth. However, the number of managers pursuing these strategies begins to decrease after that. Only 2.7 percent of the 7000+ managers in AthenaInvest’s system fall into the “economic conditions” category, meaning they base their decisions on the state of the economy. The other strategies do not take into consideration economic factors, and instead focus on finding bargains, well-managed companies, or profitable companies, depending on their specific strategy.
Based on the performance history dating back to 1980, the distribution appears reasonable. Among the five smallest categories, four of them are the worst performing strategies.
Comparison of Strategy and Boxes
A well-designed classification system should have a strong correlation within its categories, indicating common characteristics among grouped items, while also having a low correlation between categories, reflecting distinct differences between them. However, we have observed that style boxes fail to meet these criteria. In fact, our analysis has shown the opposite, with style boxes exhibiting low correlation within their own boxes and high correlation between them. Based on our findings, we believe that using style boxes to classify funds may actually be less effective than a random classification. On the other hand, our research has revealed that categorizing funds by strategies results in a higher correlation within each strategy, indicating shared characteristics, and a lower correlation between strategies, indicating distinct differences. In other words, while funds in the small value category may share similarities with those in large growth, they may not necessarily have much in common with other small value funds. Similarly, competitive position managers may have some common ground as they pursue a similar strategy, but they differ greatly from opportunity managers who have a different approach.
An important aspect to note is that diversifying through style boxes does not offer any significant risk reduction compared to randomly selecting or creating a portfolio solely from one style box. However, we believe that combining strategies can bring diversification benefits as different strategies have varying performance patterns.
Overview
By organizing managers based on their strategies, we can gain valuable insights. This approach allows us to assess the long-term success of each strategy and how it adapts to shifting economic and market conditions. In addition, it offers a way to construct portfolios that are diversified among the most successful strategies. Our upcoming paper will focus on choosing the most suitable managers for each strategy, ensuring consistency with their approach.
To conclude, it is our belief:
- The classification of managers based on their strategies holds value and significance.
- The success of a strategy is in line with its popularity.
- Categorizing strategies may prove to be more beneficial and meaningful compared to using style boxes; in addition, combining different strategies can lead to diversification advantages.
The following text has been rewritten to eliminate any instances of plagiarism by altering its structure while maintaining the same context and meaning. The markdown formatting has been retained.
The following text has been paraphrased to eliminate plagiarism while maintaining the original context and meaning. Markdown formatting has been preserved.
Additional posts written by Dr. Craig Callahan
Dr. Craig Callahan serves as the Founder and President of ICON and is the chairman of its Investment Committee. Additionally, he holds the position of Portfolio Manager for the ICON Fund, ICON Opportunities, and the Long/Short Funds. He also serves as a Co-Portfolio Manager for the ICON Risk-Managed Balance Fund.
Future outcomes cannot be guaranteed based on previous performance.
The views and predictions on various sectors, industries, companies, countries, and/or themes, as well as the arrangement and contents of a portfolio, are all subject to modification at any given moment, depending on market and other circumstances. It should not be interpreted as a suggestion for a particular security, industry, or sector.
Investing based on strategy comes with inherent risks and uncertainties, and there is no guarantee that it will result in better performance or lower costs compared to other investment methods.
Investing in securities carries inherent risks, such as the potential loss of your investment’s value. A concentrated investment in specific sectors and industries may pose greater risk and volatility compared to a more diversified investment. International securities investments may also come with distinct risks, such as political, market, regulatory, and currency risks. Generally, foreign stock exchanges and securities brokers and issuers have less governmental oversight.
To obtain the most recent version of ICON’s Form ADV, Part 2, you can either visit their website at www.InvestwithICON.com or call 1-800-828-4881. The Form ADV can also be found at https://iconadvisers.com/wp-content/uploads/ICONFormADVPart2Aand2B.pdf.
The text can be rephrased by altering the structure while retaining the original context and meaning. It is important to maintain the markdown formatting.