Introduction to Technical Analysis
Technical analysis is a powerful tool that allows traders and investors to make informed decisions by analyzing historical data and market trends. In this comprehensive guide, we will delve into the world of technical analysis, exploring its basic principles, various tools and indicators, chart patterns, trend analysis, and much more. By the end of this guide, you will have a solid understanding of technical analysis and be well-equipped to apply it in different markets.
Understanding the Basics of Technical Analysis
To begin our journey into technical analysis, it is essential to grasp the basic concepts that underpin this analytical approach. At its core, technical analysis is the study of past market data, such as price and volume, to predict future price movements. Unlike fundamental analysis, which focuses on the intrinsic value of a security, technical analysis relies on historical patterns and trends.
One of the fundamental principles of technical analysis is the idea that history tends to repeat itself. This is based on the belief that human behavior, which drives market movements, is predictable to some extent. By analyzing historical price patterns, traders can identify potential future price movements and make informed trading decisions.
Technical analysis also emphasizes the importance of market psychology. It recognizes that market participants are driven by emotions such as fear and greed, which can lead to predictable patterns in price movements. By understanding these psychological factors, traders can gain an edge in the market.
Key Principles of Technical Analysis
To master the art of technical analysis, it is crucial to understand the key principles that guide this analytical approach. These principles form the foundation of technical analysis and provide a framework for analyzing and interpreting market data.
The first principle is that prices move in trends. This means that prices tend to move in a particular direction over a period of time. By identifying and following these trends, traders can increase their chances of making profitable trades.
The second principle is that history repeats itself. This principle is based on the belief that past price patterns and trends are likely to recur in the future. By studying historical data, traders can identify patterns and trends that can help them predict future price movements.
The third principle is that prices reflect all available information. This principle is known as the efficient market hypothesis and suggests that all relevant information is already reflected in the price of a security. Therefore, traders should focus on analyzing price movements rather than trying to uncover hidden information.
Different Types of Technical Analysis Tools and Indicators
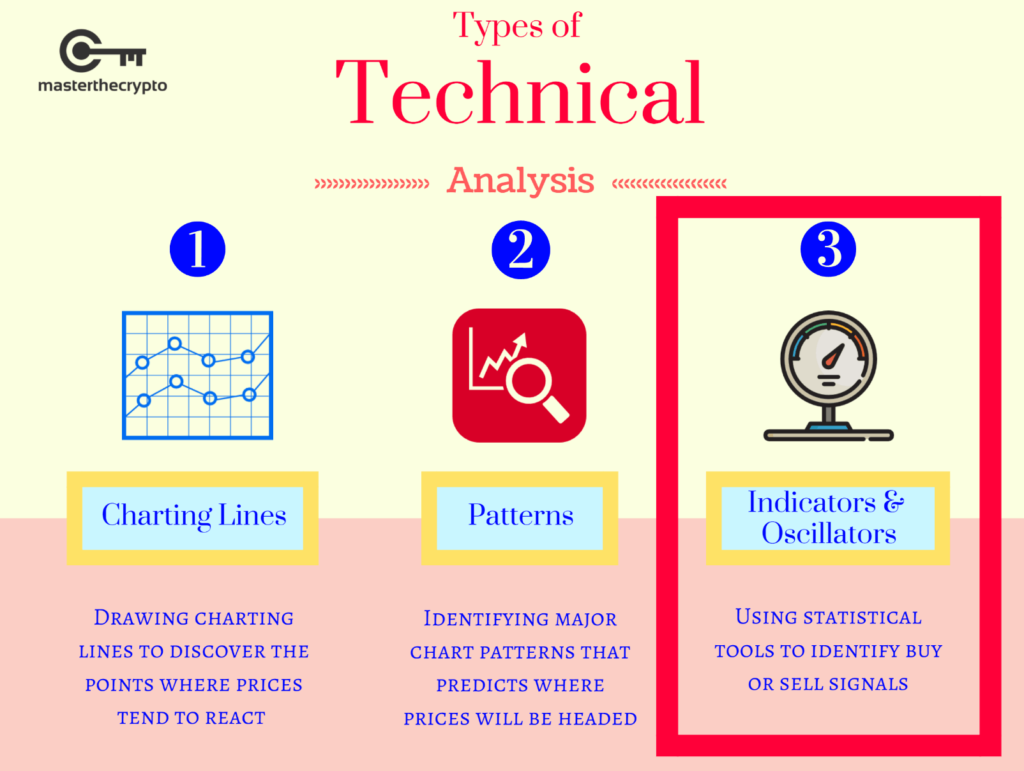
In technical analysis, there are various tools and indicators that traders can use to analyze market data and make informed trading decisions. These tools and indicators provide valuable insights into price movements, trends, and market conditions. Let’s explore some of the most commonly used tools and indicators in technical analysis.
- Moving Averages: Moving averages are used to smooth out price data and identify trends. They are calculated by averaging the prices over a specific period of time. Moving averages can help traders identify support and resistance levels as well as potential trend reversals.
- Relative Strength Index (RSI): The RSI is a momentum oscillator that measures the speed and change of price movements. It is used to identify overbought and oversold conditions in the market, which can indicate potential trend reversals.
- Bollinger Bands: Bollinger Bands are volatility indicators that consist of a central moving average line and two outer bands. They are used to identify periods of high or low volatility in the market, which can help traders anticipate potential price breakouts or reversals.
- Fibonacci Retracement: Fibonacci retracement levels are based on the Fibonacci sequence, a mathematical sequence in which each number is the sum of the two preceding numbers. These levels are used to identify potential support and resistance levels in the market.
Technical Analysis Chart Patterns and How to Identify Them
Chart patterns are an important aspect of technical analysis as they provide valuable insights into the future direction of price movements. By identifying and interpreting these patterns, traders can make informed trading decisions and increase their chances of profitability. Let’s explore some of the most common chart patterns and how to identify them.
- Head and Shoulders: The head and shoulders pattern consists of three peaks, with the middle peak being the highest (the head) and the other two peaks being lower (the shoulders). This pattern is a bearish reversal pattern, indicating that a bullish trend may be coming to an end.
- Double Top and Double Bottom: The double top pattern occurs when prices reach a high point, pull back, and then make a second attempt to reach the same high point. This pattern is a bearish reversal pattern. Conversely, the double bottom pattern occurs when prices reach a low point, bounce back, and then make a second attempt to reach the same low point. This pattern is a bullish reversal pattern.
- Triangle Patterns: Triangle patterns are characterized by converging trend lines and can be either bullish or bearish. There are three types of triangle patterns: ascending triangles, descending triangles, and symmetrical triangles. Ascending triangles are bullish patterns, while descending triangles are bearish patterns. Symmetrical triangles can indicate either a bullish or bearish breakout, depending on the direction of the preceding trend.
The Importance of Trend Analysis in Technical Analysis
Trend analysis is a crucial aspect of technical analysis as it helps traders identify the direction of price movements and make informed trading decisions. By analyzing trends, traders can determine whether to go long (buy) or go short (sell) a security.
In technical analysis, there are three types of trends: uptrend, downtrend, and sideways trend. An uptrend occurs when prices are consistently making higher highs and higher lows. A downtrend occurs when prices are consistently making lower highs and lower lows. A sideways trend, also known as a range-bound market, occurs when prices are moving within a specific range without making significant higher highs or lower lows.
To identify trends, traders can use various tools and indicators, such as moving averages and trend lines. Moving averages can help traders determine the overall direction of the trend, while trend lines can be used to connect the higher highs or lower lows to visualize the trend.
Using Support and Resistance Levels in Technical Analysis
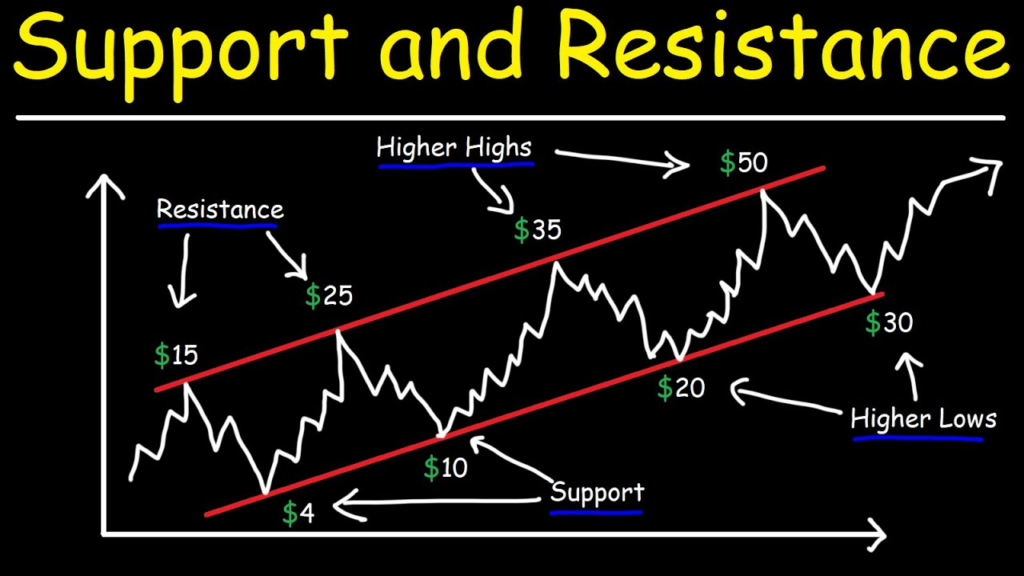
Support and resistance levels are key concepts in technical analysis as they help traders identify potential price levels at which the market may reverse or consolidate. Support levels are price levels at which buying pressure is expected to overcome selling pressure, causing the price to bounce back up. Resistance levels, on the other hand, are price levels at which selling pressure is expected to overcome buying pressure, causing the price to reverse or consolidate.
To identify support and resistance levels, traders can use various tools and techniques, such as horizontal lines, trend lines, and pivot points. Horizontal lines are drawn across price levels where the price has historically found support or resistance. Trend lines are drawn by connecting the higher lows in an uptrend or the lower highs in a downtrend. Pivot points are calculated based on the previous day’s high, low, and closing prices, and can help traders identify potential support and resistance levels for the current day.
Applying Technical Analysis in Different Markets (Stocks, Forex, Cryptocurrency)
While technical analysis can be applied to various markets, such as stocks, forex, and cryptocurrency, it is important to understand that each market has its own unique characteristics and dynamics. Let’s explore how technical analysis can be applied in these different markets.
In the stock market, technical analysis can be used to identify potential buying or selling opportunities based on price patterns and trends. Traders can analyze historical price data and indicators to make informed trading decisions.
In the forex market, technical analysis is widely used by traders to predict future price movements and identify potential entry and exit points. Traders can analyze currency pairs using various tools and indicators, such as moving averages, trend lines, and support and resistance levels.
In the cryptocurrency market, technical analysis is particularly valuable due to the high volatility and lack of fundamental data. Traders can analyze historical price data and chart patterns to identify potential trends and reversals.
Common Mistakes to Avoid in Technical Analysis
While technical analysis can be a powerful tool, there are common mistakes that traders should avoid to maximize their chances of success. Let’s explore some of these mistakes and how to overcome them.
One common mistake is overcomplicating the analysis. Traders may use too many indicators or rely on complex trading strategies, which can lead to confusion and indecision. It is important to focus on a few key indicators and develop a simple and effective trading plan.
Another common mistake is ignoring risk management. Traders may become too focused on potential profits and overlook the importance of managing risk. It is crucial to set stop-loss orders and adhere to proper risk management techniques to protect capital.
Lastly, emotional trading is a common mistake in technical analysis. Traders may let fear or greed guide their decisions, leading to impulsive and irrational trading. It is important to stick to the trading plan and remain disciplined, regardless of market conditions.
Resources and Courses to Enhance Your Technical Analysis Skills
To enhance your technical analysis skills, there are various resources and courses available that can provide valuable insights and practical knowledge. Here are some recommended resources:
- Books: There are many books available on technical analysis, ranging from beginner guides to advanced topics. Some popular titles include “Technical Analysis of the Financial Markets” by John J. Murphy and “Japanese Candlestick Charting Techniques” by Steve Nison.
- Online Courses: There are numerous online courses that offer in-depth training on technical analysis. Platforms such as Udemy and Coursera offer a wide range of courses taught by industry experts.
- Webinars and Workshops: Many financial institutions and trading platforms offer webinars and workshops on technical analysis. These events provide an opportunity to learn from experienced traders and ask questions in real-time.
- Online Communities and Forums: Engaging with online communities and forums can be a valuable way to learn from other traders and share insights. Websites such as Reddit and TradingView have active communities dedicated to technical analysis.